How to Use Benchmarking to Evaluate Website Performance

The amount of metrics available to you to evaluate your website’s performance can be overwhelming. How do you know which data points are the most important and whether or not yours are “good” numbers?
Without any set goals or reference points, website analytics are meaningless. But as you track your metrics over time and build points of comparison — to your own historical data and to that of others in your industry — metrics become one of the most valuable ways to measure your website’s performance. Here are a few tips for finding and using benchmarks to make sense of your website analytics.
Metrics that matter
When reviewing your analytics, it can be tempting to rely on traffic metrics such as visitors and sessions (visits). Traffic metrics can be a good place to start to give a holistic picture of how your site is performing when compared to a previous period. However, these metrics are hard to draw actionable conclusions from, and they tell little detail about a site’s interactivity or which specific pages need improvement.
Instead, paying attention to metrics that measure engagement can give more insight into whether or not users are interacting with a site. Engagement metrics include average session duration, pages viewed per session, bounce rate and conversion rate. If these terms sound foreign to you, check out our article on deciphering Google Analytics terminology.
Engagement metrics are valuable as an overall measure of interactivity across your site, but it can be even more helpful to look at these metrics page by page to determine what is and isn’t working to engage and convert your visitors as you create and adjust your content and design to lead more prospects down the sales funnel.
Set goals
Before you begin to evaluate your website’s performance, make sure to set goals. Defining the purpose of each page of your website will help you identify which metrics make the most sense to measure success and where you should focus your energy in making improvements.
For example, if you are starting a blog to share thought leadership content, your goals may be to drive more traffic to your site from organic search with a good SEO strategy and to have a high average time on page that shows people are reading your articles. You may care less about its bounce rate because even though a high bounce rate is usually “bad,” blogs or news articles often have high bounce rates.
This is because so many users will find an article via search or social and then leave the site after they find and read what they were looking for.
Compare to benchmarks
Once you know which metrics are the most valuable to track and have set goals for your site, it’s important to have benchmarks that serve as a comparison point for your website’s analytics. Benchmarks that you should reference include the goals you set for your website’s performance, your own website data over time to measure growth, and industry standards.
Benchmarking with your own site
Traffic metrics, such as sessions (site visits) and visitors are meaningless on their own, but they start to tell a story when compared with the same data points over time. In other words, your own site’s historical data is the best benchmark for site-wide traffic metrics.
Traffic metrics will ebb and flow over time depending on the quarter, so they’re best compared quarterly (Q1 2021 with Q1 2022, for example). This helps to mitigate external factors, such as holidays and slower parts of the year.
Your own site’s historical data is also a great benchmark when you’ve changed a certain page layout or boosted your SEO. Comparing before and after the change can give you a good feel for whether or not the change boosted traffic or engagement. In this case, you’ll want to drill into page-specific metrics, such as pageviews, average time on page and bounce rate to get a more accurate feel for the impact of your change.
Again, comparing recent data post-change to the same period last year is a good idea in order to control for external factors, even if the change was more recent.
Benchmarking in Google Analytics
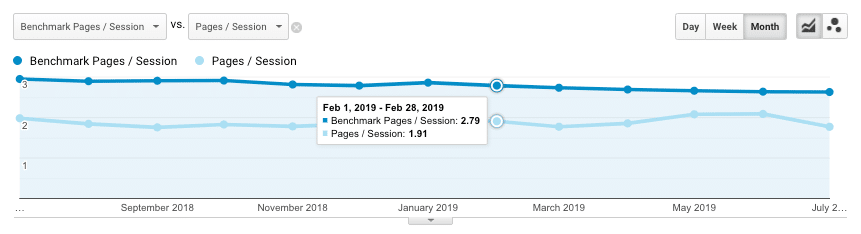
Benchmarking against industry players is another important step to figuring out how your site measures up, site-wide. One way you can find industry benchmarks from real data is in Google Analytics with a feature called Benchmarking. The tool allows you to compare your website’s data to that of other companies within an industry. It’s the closest thing you can get to comparing your analytics to those of your competitors.
Benchmarking can be found under the Audience tab on the left side of your Google Analytics dashboard. In this section, you can manually select an industry, location, and company size based on daily sessions, and Google Analytics will aggregate data from all other properties that fit those qualifications to establish the “benchmark.”
This average only accounts for companies who have allowed their data to be used for benchmarking in their settings.
For example, a construction firm could choose websites under the industry vertical “Construction and Maintenance” that are within the United States and that have average daily sessions between 100 and 499. Google Analytics then instantly compares those average data points to your own website data.

There are a number of acquisition and user behavior metrics you can look at from new users to bounce rate and pages per session. You can also compare these data points by Channel (Organic Search, Direct, etc.), Location, or Device, and Google Analytics will display the percent difference between yours and the benchmark for each.
Research can be an easy way to supplement metrics from your own site and from Google Analytics benchmarking. For best practice, it’s wise to use a combination of both Google Analytics benchmarking and research from industry experts or industry competitors.
How to use benchmarks
Benchmarking should be used to see where you can improve your website for your users. Which pages have unusually high bounce rates compared to the industry average? Is your average session duration shorter than that of similar websites? Addressing questions like these will provide you with insight about where users’ needs are not being met and will help you create a great user experience for your visitors.
For example, to decrease bounce rate, you could place different CTAs or redesign your navigation to encourage exploration of the site. Examining individual webpages can also give you better insights. It may be best to optimize bounce rate on individual pages rather than focus on the entire website average.
The users visiting your blog have a completely different goal than users who came to your site in need of a service from your industry. So it may be more useful to compare your bounce rate to industry benchmarks on a landing page meant to draw visitors into your site and take action than on your Contact page.
Success is not solely measured by how you compare to others
Benchmarking is a great tool, but all in all it’s still essential to single in on your own analytics. Record your identified KPIs each month, and then track how those data points change over time. Success is not only measured by how you stack up in comparison to others, but by how you are growing and how you are meeting the needs of your target audience.
Google Analytics Research
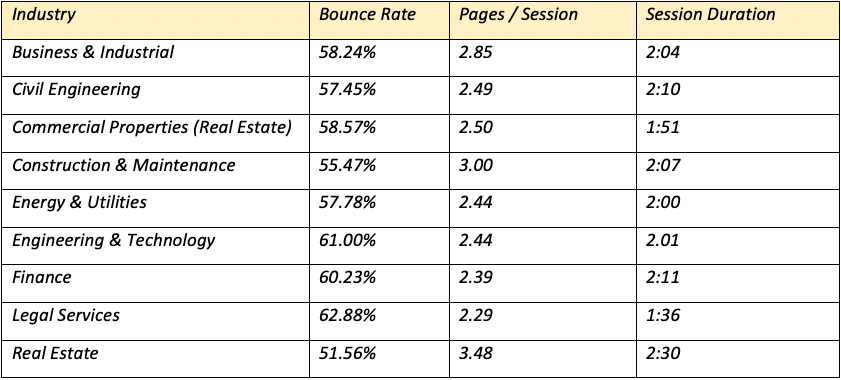
Using Google Analytics’ Benchmarking tool, we researched a few key metrics (bounce rate, pages per session, and session duration) for various industries. All of these statistics are based on properties from the USA that receive between 100-499 sessions, pulled from July 2018 – July 2019. You can see that these benchmarks vary from industry to industry, making it difficult to identify what a “good” benchmark is. It’s desirable to be competitive in your industry, but remember to focus on what makes your website different, capitalize on your individual strengths, and track your own growth.
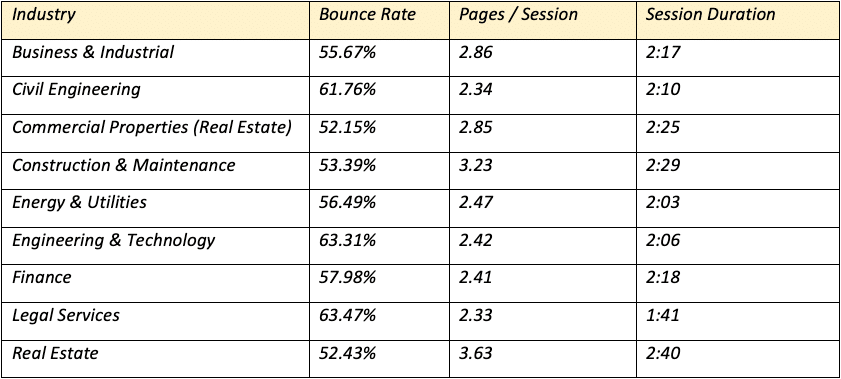
And below are statistics based on properties from the USA that receive between 500-999 sessions, pulled from July 2018 – July 2019.
By signing up you are agreeing to our Privacy Policy.